• Wondering which camera, gear, computer, or software to buy? Ask in our Gear Guide.

Loudness or, How to measure what doesn't exist?

I'm starting this thread in response to another thread where an IT member was using audio (dB) levels as a reference to loudness. I pointed out that there is no correlation between dB levels and loudness, which eventually led to several members expressing interest in knowing more about loudness and the way it is measured.

To many here this subject may appear utterly uninteresting and arguably it is! However, the consequences of this dull technical subject have affected a US Presidential campaign and resulted in new laws and/or regulations of TV production and broadcast in virtually all "Western" countries in the last couple of years. Furthermore, these regulations are starting to spread to online distribution and there has been discussion of them in commercial theatrical circles too. So, boring or not, it's something every filmmaker should know a bit about and aspiring professional filmmakers should have a pretty reasonable understanding of. So, IMHO, it's worth having some reference material on the subject available on IT.

I'm going to explain a little of the history about where we are, how we got here and why it was a big enough problem to involve a US President, various international bodies and national governments.

So far, this story sounds mildly interesting but in all honesty, it really isn't! :) It's quite technical but I'll do my best to keep it simple when I actually start explaining in the next post.

G
 
You should start with a "Kindergarten" class on the various dB measurements.

You're right, I should. But if I do, I'll end up with an even longer post with a logarithmically higher boredom level (pun specifically intended for Bob's benefit!), so I'm going to try it with the minimum amount of explanation of dB scales I think I can get away with. If it turns out that I've failed, then I can always add more of a dB explanation in a later post.

Cheers, Greg
 
Part 1

Our story is really in two parts, which didn't really start to come together until the late 1990s. One part is in the field of psychoacoustics, the science of how we perceive sound. The second part is in the science of physics/electronics, how we measure signals (sound).

To an extent, the problem started in the 1930s when two scientists (Fletcher & Munson) working for Bell Labs created what are now called an "equal loudness contours". It's important we understand a bit about these equal loudness contours because they demonstrate and quantify that our hearing and perception of loudness is not related to output level, it changes depending on frequency (pitch). Not only is there a contour, rather than a straight line (which would indicate a linear perception of loudness, IE. higher level = louder) but the contour changes shape depending on the output level. This may sound a little confusing, so I'm going to show you the Fletcher/Munson Curves below and explain what you're seeing, it's really quite simple and straight forward:

Fletcher_munson_elc.png


To obtain these contours, Fletcher and Munson played signals at various frequencies (pitches) to people through speakers and adjusted the output level of the different frequency signals until the listener indicated that they appeared to be the same loudness. They did this with a substantial number of people and then averaged the results.

So what is this graph actually telling us? If we take the bottom contour for example, the graph shows us that a signal (sound) with a frequency (pitch) of about 30Hz, indicated on the x-axis, needs to have an output level, indicated on the y-axis, roughly 75dB higher than a signal with a frequency of about 3000Hz (3kHz) to sound the same volume (loudness). In other words, our hearing is 75dB more sensitive at 3kHz than it is at 30Hz. To put this into perspective (as the dB scale is logarithmic), a difference of 60dB is a difference in output level of 1000 times! However, looking at the top contour, our hearing is a little more linear because a 30Hz signal only needs to be about 20dB (10 times) higher in order for it to sound the same volume as a 3kHz signal. What this means in practical terms is that when we are listening to say a music recording, the bass will appear to get louder (relative to the treble) the higher we set our output volume. In other words, the (EQ) balance will appear to change. It makes EQ'ing a problem because the balance we are trying to achieve by EQ'ing in the first place is actually more determined by the volume at which the listener is playing back the mix than it is by however we are fiddling around with EQ knobs! This is the main reason why calibrating the mixing environment is of such vital importance, but I'm veering off track here! If nothing else, these curvy lines should at least show you that there's little relationship between the dB level you're reading in your NLE and the actual loudness of a sound. It mainly depends on the frequency content of the sound. Notice too how there appears to be a peak in hearing sensitivity at around 2kHz-4kHz, this is due to the resonant frequency of the human ear canal and it's assumed we have evolved this sensitivity because this frequency range is important in differentiating between many different types of consonants. The only reason I mention this is because it plays a big role in another part of our story and I'll need to come back to it.

This leads us on the second part of our story in the next post.

G
 
Last edited:
Excellent thread AudioPostExpert.

The loudness and db issue confuses the hell of me too. Particularly given the general sound recording advice to have your audio (when recording) averaging -12db...

When filming recently, one of the actors played a depressed person and when booming, we couldn't get their audio above -30 db. I then thought: should I boost that audio in post to -12 db.

Confusing... Thanks for doing this thread! Bookmarked!
.
 
Part 2

The next part of our story is how to measure a signal (sound) and that presents it's own problems, to which there have been a quite a number of solutions over the years. Alcove suggested I go into some of various scales and the ways (metering methods) of measuring them: VU meters, BBC PPM meters, Nordic PPM meters, Leq metering, etc., but to be honest, a lot of them have now been superseded by the new loudness metering paradigm and those which are still used are for slightly different purposes so I'm going to avoid discussing them, to try and keep this simple.

The only scale we're interested in for now is the dBFS scale. This is the one you are used to, the one in your NLE or audio software program. It shows you the peak sample values in your digital audio file using the logarithmic Decibel scale. We obviously need to know this value because for one thing we need to know how close to the maximum limit we're getting, which in the dBFS scale is, as you know, 0dB. While it's very important to know and monitor this peak limit, it doesn't really tell us much because many/most sounds have what's called a transient; a high burst of energy of usually a few milliseconds, before the main body of the sound which may be slightly (or greatly) lower in level. A peak meter shows us these transient peaks accurately but are rather more vague with the overall value of the entire sound. For this reason we have RMS meters, which uses a mathematical "trick" to create an average. BTW, we need a mathematical trick because all sound is based on sine waves and the average of any sine wave is always zero. It's extremely easy to build a meter which always reads zero (I know, I've built one myself, though sadly not deliberately!) but of course it's not of any practical use! Here's an image which shows all this graphically (From John L Sayer's website)
Transient2.gif


For many years TV broadcast delivery specs were based on a quasi-peak meter, essentially a very slow peak meter which ended up giving you a reading which was sort of half way between a peak meter and an RMS meter. When the digital age came along the specs were eventually changed to include both a quasi-peak meter (which still used the old analogue scale), where you kept the meter around 5.5-6 (in the UK) and a peak digital meter (same as the one in your NLE), where you kept the peak level below -9dBFS. Other countries used slightly different quasi-peak meters or VU meters (a type of analogue based RMS meter, which are still used for certain calibration tasks) along with a digital peak meter. The peak and average (or quasi-average) delivery specifications varied depending on the country/broadcaster. This of course caused problems for content makers because a mix for one broadcaster might not pass delivery specs for another broadcaster, so different mixes might have to be created or the programs were just crushed with a broadcast limiter to fit a different broadcaster's specs. It also caused problems for the consumer who could experience a big jump or drop in the volume when they changed channel or even between content on the same channel, when the broadcaster aired content brought or licensed from another broadcaster.

If this wasn't bad enough, the consumer also suffered from a deliberate loudness war, not just between different broadcasters but even between content on the same channel! Those who pay for commercial television's existence, the advertisers, always want to grab the attention of their audience. The easiest way of doing this was to make their adverts louder than the TV programs which surround them, and louder than everyone else's adverts! Which brings me back to part one and the simple fact that as demonstrated by Fletcher/Munson, peak and even RMS levels are no indicator of loudness, only of the energy contained in an audio signal. The advertisers accomplished their aim by effectively taking advantage of the Fletcher/Munson curves and the difference between broadcasters' audio peak/average level specs and the perception of loudness. In other words, TV commercials found a way of both staying within the same broadcasters' specs as everyone else AND sounding much louder than everyone else. I know all this for a fact, because I'm one of the people who did it! I've mixed a considerable number of TV commercials over the years.

Remember the Fletcher/Munson curves and the peak human sensitivity in the 2kHz-4kHz I mentioned before? As a mixer, if I can somehow concentrate a fair bit of the allowable energy of my mix in this peak sensitivity range, my mix is going to sound much louder than a mix which is more evenly spread throughout the spectrum. With exactly the same amount of audio energy, I (along with every other professional mixer of TV commercials) could make a mix sound roughly twice as loud as the TV program it was following or preceding and if I refused or couldn't make it louder, the advertising agency would just dump me and go to someone who could. As the years rolled on, digital technology got more and more efficient and we got better and better at making commercials louder by exploiting the perception of loudness and pushing the limits of the specs. Meanwhile, the consumers got more and more pissed off, either due to the large differences in loudness between adverts and programs or because we were sailing so close to the limits they often experienced various distortions/artefacts from their TVs! Eventually, consumer complaints about sound quality and volume far outnumbered all the other technical complaints/issues combined! To address these complaints the broadcasters would change the specs but almost as quickly as they could change them we would find a loophole based on the perception of loudness vs the method of measurement. It was a fun game, provided you could keep up with the latest mixing tricks and cheats!

Eventually, consumer complaints reached such epic proportions that Obama's election campaign included a pledge to support a law to address the problem. In all fairness, the world's main broadcasters had been working for some years under the ITU (International Telecommunications Union) on a new approach to the problem, by actually trying to measure loudness, rather than measuring audio energy. However, they'd been dragging their heels a bit, getting agreement between all the broadcasters was tricky and no one really wanted to take the plunge to standardise loudness and risk pissing off their advertisers. The CALM Act (Commercial Advertisement Loudness Mitigation Act) was passed into law by Obama in dec 2010 and came into force in dec 2012. It has been reported as being the most popular piece of legislation to pass through the US senate for 20 years and was passed unanimously! It is now a legal requirement that broadcasters implement the ATSC (Advanced Television Systems Committee) loudness specifications (as detailed in the ATSC A/85 document), which are based on the ITU-R BS 1770 recommendations. In parallel with the ATSC, the EBU (European Broadcast Union) are also implementing a system based on the ITU-R BS 1770 recommendations - the EBU R128 spec, but the roll out is happening much more gradually in Europe as the EBU R128 specs are a recommended practise rather than a legal requirement. Germany, France and several other countries have already implemented it and the major UK broadcasters, through the DPP (Digital Production Partnership) announced new delivery specs which include full EBU R128 compliance from Oct 2013. Canada and Australia have also in the last year or so passed laws based on ATSC A/85 specs and Japan has, or will very soon. With all the (so called "developed") countries adopting either the ATSC A/85 or EBU R128 the rest of the world will eventually follow suit.

In the next part, I'll explain what this clever ITU-R BS 1770 system is, how it's been applied by the ATSC and EBU and what the compliant meters actually measure and display.

G
 
Last edited:
Part 3

Before I get into the guts of the ITU system and the ATSC and EBU implementation, I should mention that the company responsible for so many advances in audio presentation had not been sitting on their laurels. By the mid/late 1990s Dolby had created a consumer version of their Dolby Digital (DD) 5.1 format originally designed for 35mm film. The consumer version (also called Dolby Digital or Dolby AC-3) was a lossy streaming format which differed from the theatrical version by the inclusion of the Dialogue Normalisation (DialNorm) parameter. Dialnorm was an attempt to control levels by using a relatively complex system which isolated and "ancored" the dialogue, attenuated levels and included a scheme of compression presets, all of which was controlled by information embedded in the metadata of the AC-3 stream. Amid allegations of bribery, Dolby beat out the competition (from MPEG-2 and AAC) to be accepted as the audio format standard for HDTV by the ATSC and eventually accepted internationally. If true, the bribery was money well spent as all HDTV compatible devices have to license DD technology, which has netted Dolby billions! DD provides processing which allows the automatic "downmixing" of the 5.1 datastream to 2.0 (stereo) so those without a 5.1 home cinema system can still hear the audio. Dolby went on to develop and release an enhanced AC-3 version (EAC-3) called Dolby Digital Plus, which includes a wider variety of lossy data compression ratios and audio compression presets, which allows the DD stream to be more easily downloaded and output on devices with reduced dynamic range (laptops and smartphones for example). DD Plus is the audio format currently employed by Netflix (and some others) for it's HD content.

So what is the ITU-R BS. 1770? It's essentially a set of algorithms designed to define and standardise two things: 1. A new type of peak measurement, required to resolve problems caused by only measuring peak sample values (as the meters in your NLE currently do) and 2. A new type of RMS based measurement which is aligned to the human perception of loudness.

1. True Peak.

I'm afraid I'm going to have to explain a little digital audio theory, so you understand the problem and how the ITU have addressed it: Digital audio works on the principle of measuring an analogue waveform at periodic points in time and assigning a value (encoded in data bits) to each of these periodic measurements, called "samples". This process is called Analogue to Digital Conversion (or ADC for short). The reverse process (Digital to Analogue Conversion, DAC) uses mathematical algorithms to convert the data back into an analogue signal which your speakers can output. I won't go into any great detail, except to mention that the theoretical work of Harry Nyquist and Claude Shannon dating back to the 1930s resulted in what is now called the "Nyquist/Shannon Sampling Theorem" upon which all digital audio technology is based. The Nyquist/Shannon Sampling Theorem mathematically demonstrates and proves how continuously varying analogue audio signals can be converted into discrete digital audio data packets and back again with 100% accuracy (IE. Perfectly linearly). The diagram below provides a graphic representation of this sampling process and also shows a potential problem!

Intersample.jpg


Notice how the sampling points (the dots) are all legal, 0dBFS or lower, but the analogue waveform when reconstructed from the digital samples in places is not! These illegal peaks which occur between our sampling points are called "Intersample Peaks". Digital to Analogue Converters (DACs) when converting the digital audio data to an analogue signal, oversample, which means that they re-sample at a much high sampling rate (this is for computational reasons which I won't go into). The standard sample rate for audio/visual content is 48kHz (48,000 samples per second) but oversampling increases this to many millions of samples per second. In other words, in our graph above, there would be many more additional sampling points between the ones currently shown. Some of the new oversampling points would be on our intersample peaks and these samples would have illegal values (values above 0dBFS) but as there are no values above 0dBFS what we would actually hear is clipping (digital distortion). Oversampling is also part of the procedure of transcoding to another format, say MP3 audio format, AC-3, AAC, etc. This is why you often hear clipping and digital distortion on Youtube and other places where the content has been created by amateurs who don't know how digital audio works. Their audio might appear to be entirely legal (all sample peaks below 0dBFS) according to their NLE's meters, but when they post it up to Youtube, yuck! So, the ITU created a scale called dB True Peak (dBTP, rather than dBFS), which effectively just oversamples the digital audio data to include the intersample peaks in the measurement. In other words, a dBTP meter reading would always be higher than the dBFS meter reading of the same signal, which of course results in you lowering your output mix level to keep the dBTP reading "legal". Both the ATSC and the EBU specs include a maximum peak level expressed in dBTP: -2dBTP being the maximum allowable level in the ATSC A/85 specs and -1dBTP in the EBU R128 specs.

I'll deal with point 2, the new type of RMS measurement in Part 4. Don't worry, it doesn't involve as much audio theory!

G
 
Last edited:
Found a larger image of the above diagram:

Illegal_signal.jpg


Fairly interesting "loudness" post, G.
I'm looking forward to integrating this into future audio design and production.
 
Although I can easily translate the meter readings back and forth between analog and digital VU meters I'm having a difficult time figuring out how to translate the values to the right on that above diagram.

klanghelm_VUMTDUOamber.jpg
<-- Get it.

21167_8.jpg
<-- Get it.

Intersample.jpg
<-- Don't get it.​


UPDATE: Uh... waitaminit. I think I just figured it out. Tiny little negatives below the top zero line, and above the bottom zero line.
Got it.
Still don't understand how the wave line crosses over from... left and right?

Also, the above diagram (the one in question on how to translate the values running from the top to bottome zero line) very much matches what many of us DIY-ers see in our DAWs like Audacity.
Audacity-SelectionCursor.png

So... I'm kinda at a loss on how to adjust the loudness/volume to provide "optimal" output for "greater than youtube's wild west standards", for a film festival, for instance.
 
Last edited:
So... I'm kinda at a loss on how to adjust the loudness/volume to provide "optimal" output for "greater than youtube's wild west standards", for a film festival, for instance.

That's because I haven't told you how to yet! Hopefully it will be clearer when I've finished all the parts of my post. So far I've mainly provided history and information but eventually I'll get around to putting it all together and give you something actionable to work with! In the meantime, I'll deal with other points in your post:

Unfortunately, you are bunching together a lot of different, unrelated things and trying to relate them to each other! I'm not sure how you're translating the readings between an analogue VU meter and a digital VU meter because really there's no such thing as a digital VU meter! VU meters were the first type of meter which tried to get closer to loudness than just a peak meter. They failed however because they were still based entirely on measuring audio energy without taking into account how frequency affects the perception of loudness. VU meters are essentially a type of quasi-peak meter, meaning it's a peak meter with a very slow response time (300ms if I remember correctly), which ends up giving you a reading which is somewhere between a peak meter reading and an RMS meter reading (see part 2). The 0VU point does NOT equate to 0dBFS, it equates to an actual voltage output 1.223v (assuming a standard +4dBU professional output level). In other words, the analogue outputs of a digital system are aligned to equal 0VU depending on the application. In the theatrical film world, 0VU = -20dBFS. To be honest, Alcove warned me about this and I've been trying to avoid it! For the users here, it would be best to avoid VU meters, it's not going to give you any usable information, just try and imagine that you've never heard of them!

Your second image is a standard sample peak meter as found in NLEs but also includes a secondary RMS scale, which I explained briefly in Part 2. Again, the RMS meter is not going to give the users here any usable or actionable information, so avoid them!

Image 3, the one I posted. I think you're getting confused by the white lines? The white lines are just guide reference lines showing -1dBFS. The red line is minus infinity (nothing). Remember, all sound is based on sine waves, which oscillate around the zero crossing point (minus infinity). You may have noticed a slight problem here, I'm referring to something called "minus infinity" whereas in your program (Audacity) the minus infinity line on the y-axis is labelled "0.0". The problem is that in digital audio the maximum value possible is 0dBFS, so if 0dBFS is the maximum, what is the minimum (or nothing), it can't also be zero?! Nothing or, the opposite of the maximum possible value (0dBFS) is therefore correctly called minus infinity, so we don't end up getting our zeros confused! However, just to make sure that people who aren't audio experts don't have a clue what we're taking about, :) when we're talking about a waveform oscillating about the minus infinity line, we usually refer to this line as "the zero crossing point", which to be honest is technically incorrect.

To be honest, I can't quite work out what scale the y-axis in your program actually is, it appears completely arbitrary.

Although your image 4 and my image (your image 3) have quite a bit in common they are in fact showing completely different things!!! The x-axis on both images is time, although your image is massively zoomed out compared to mine. The dots on mine represent sample points so at 48kHz, the amount of time between each point is 1/48000th of a second. My entire image is showing roughly 0.0026 seconds worth of sound whereas yours is displaying about 40 seconds worth. If you were to zoom all the way in on your image you would see a series of blocks, a bit like a shallow staircase. Each of those blocks represents a sample value. In other words, what your image 4 is showing is a graphical representation of all the sample values. That's NOT what my image is showing! The sample values in my image (the bright green dots) are all 0dBFS, if you were to import these same sample values into your audio program (Audacity) and zoomed into the same resolution as my image, what you would see is a series of blocks all the same height (the height which equates to 0dBFS), effectively a flat staircase. The pale green line in my image is not showing the sample values, it's showing the analogue waveform which will be reconstructed from the sample values. When the first graphical digital audio editors were invented, someone decided to display the data (sample values) so it looked like an analogue waveform displayed on an oscilloscope, presumably to make the analogue audio engineers of the day feel "more at home" switching to digital. Maybe in that regard it worked but in the long term it's caused no end of confusion and misunderstanding! Just to recap, Audacity is not showing you an actual audio waveform, it's showing you encoded digital audio data in a graphical style which looks like it could be a waveform!

Not sure if any of this has helped? If not, ask again, maybe after my I've finished with the "Parts".

G
 
Last edited:
Part 4

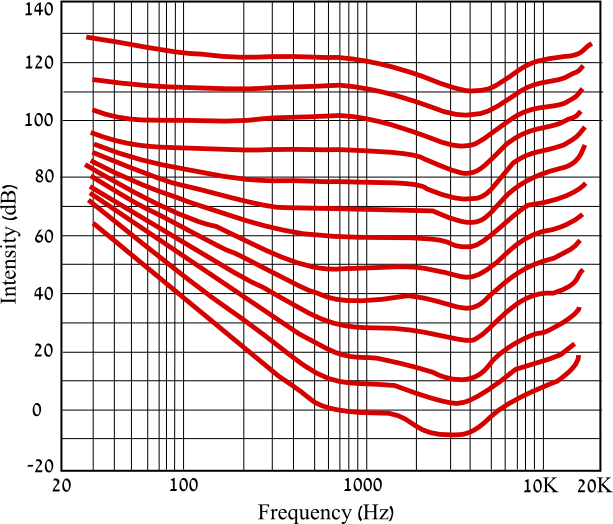
OK, so point two of what the ITU-R BS.1770 specification is attempting to define and standardise. For this we need to go back to Part 1 and the Fletcher/Munson Contours or rather we don't! Fletcher and Munson's experiments and studies have been repeated many times in the intervening years and indeed the ITU did hundreds themselves, over the course of several years. The end result was a single new contour, similar to Fletcher/Munson's but aligned with average TV listening volumes. This single contour can now be applied as a filter, to "weight" the output of each audio channel (the 5 main channels in 5.1 or the 2 channels in stereo), then the output from these weighted channels is summed together and averaged over time. The result is expressed in a new "loudness" scale. And to a large extent, this time it truly is a loudness scale (as we perceive loudness) because it accounts for our frequency dependent perception with the weighting. Although, we need to be aware that this weighting is not based on a scientific measurement, it is still impossible to measure a perception, it is the average of many hundreds of people's judgement of what sounds the same volume. Just wanted to be clear! BTW, the filter is officially called k-weighting and here is a plot of it:

K-weight.jpg


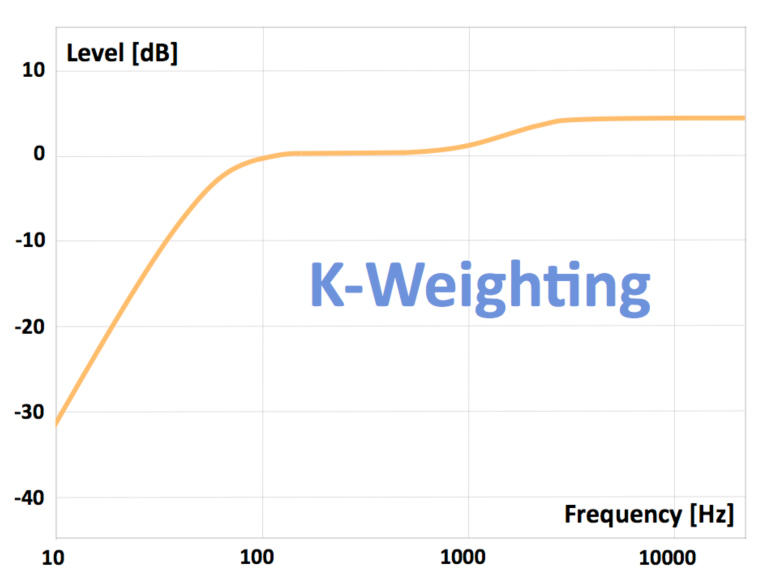
Notice for example the high shelf which starts at about 1kHz and reaches it's maximum at about 3kHz. What this means is that any 3kHz content in our mix is going to register on our loudness meter as 5dB higher than it actually is. Bang goes our trick of making our mix sound louder by concentrating energy in the most sensitive area of hearing. In fact, this k-weighting puts paid to ALL the frequency perception loopholes we used to exploit! And, summing and averaging (RMS) the k-weighted output also put's paid to all the compression, multi-band compression and limiting loopholes. The averaging is potentially a problem though, over what period of time do we average the signal? This new loudness normalisation paradigm includes 3 averages:

1. Momentary Loudness - averaged over 400ms (0.4secs).
2. Short-Term Loudness - averaged over 3 seconds and
3. Long-Term Integrated Loudness - averaged over the entire duration of the film/program.

For film/content makers it's really only the Integrated Loudness which is specified, Short-Term is usually only part of the specs for short duration content, roughly 30 secs or less; commercials, idents, etc.

So, now we've discussed all the main elements, we're just left with how they are applied in the ATSC A85 and EBU R128 specs. Well, just to confuse everyone, the loudness scale used by the ATSC and EBU have different names but both are based on exactly the same ITU standard and so for all intents and purposes are completely identical! The ATSC scale is called LKFS (Loudness K-weighted relative to Full Scale) and the EBU one is called LUFS (Loudness Units relative to Full Scale) but remember, they are equal, so for example; -18LUFS = -18LKFS.

For general programs the ATSC specs are: -24LKFS ± 2LKFS (Integrated Loudness), peak limit -2dBTP.

For general programs the EBU R128 specs are: -23LUFS ± 1LUFS (Integrated Loudness), peak limit -1dBTP.

Finally, we've got there! The keen eyed amongst you will have noticed that an EBU R128 compliant mix limited to -2dBTP would in fact also be an ATSC A85 compliant mix. In theory this is true but in practise some broadcasters are tending towards strict adherence and only accept an LUFS or LKFS integrated loudness level smack on the button. Some even more keen eyed might have noticed another loophole. If the target loudness is averaged over the entire program, what's to stop you having some really quiet sections so you can really blast the loud parts, the average would stay the same? The EBU's PLOUD working group thought of this too and introduced a gating system, if the audio drops 10LUFS below the target integrated loudness the integrated loudness measurement is paused until the signal rises above this gating threshold. This gating feature was incorporated into ITU-R BS 1770-2 and as the ATSC A85 specifies compliance with whatever the latest ITU-R BS 1770 revision is, it's automatically part of the ATSC specs too now. Bang goes another loophole! The only potential loophole I can see still remaining is that in 5.1 the .1 (LFE channel) is not currently part of the loudness measurement but as this channel is bandlimited to 20Hz -120Hz I can't see a great deal of mileage in this loophole and anyway, I've just read that the EBU are working on getting a new ITU revision to plug this loophole too. Audio post professionals have had access to these new loudness metering tools for about 3 years or so now and so far no one (that I know of) has found any tricks or cheats to make program material sound louder, as we used to, often within days of them changing the old (pre-loudness) specs. Of course, the advertising agencies at first tried to get us to still make louder mixes but our answer is "sure, no problem but you realise that in the US, Canada and other places it can't be broadcast because it would be against the law and in the EU it will be rejected by the broadcasters"... Q: " I want a louder mix though, what can I do?" A: "Get the ITU to change their specs and/or the US and other countries to change their laws" ... [silence] .... :)

So, it looks like the whole thing is actually working as intended and other areas of the audio industry are taking note. iTunes Radio has implemented a version of loudness normalisation and so has Spotify and the EBU is currently working on coming up with a version for all Radio broadcasters/stations. The theatrical film industry has always used a system of making sure the calibration of full-sized Mix Stages matched the calibration of the cinemas (0VU = 1.223v = -20dBFS = 85dBSPL) and therefore what's too loud in the cinema would also be too loud on the Mix Stage but this system, which has worked well for many years, is starting to fail (for various reasons). I think eventually we'll see loudness normalisation come to theatrical films too but to theatrical trailers and commercials first. It also seems extremely likely that some of the more quality conscious VOD distributors will eventually implement loudness normalisation, NetFlix and iTunes for sure, "when?" is the only question in my mind. As I've mentioned many times here, Youtube has no audio standards, but a sort of convention than many audio post pros are currently using for professional quality content heading for Youtube is an integrated loudness of -16LUFS/LKFS.

I haven't really mentioned LRA, which is essentially dynmanic range in terms of the loudness scale. At the moment I haven't seen any specs which specify an LRA target value or maximum, so far us professionals are just using our own judgement but I'm sure we'll start to see it specified at some stage. There are of course many other areas of broadcaster and distributor audio specs which I haven't covered, I've only covered the basic loudness measurement part of modern TV audio specs.

I should mention another caveat; some/much of the information I've presented in these posts is massively simplified. So much so that in some cases I've had to sail close to the wind of actually ending up presenting inaccurate information. Hopefully I've not actually crossed any boundaries though.

Fire away if there are any questions, I'm sure my simplified explanations have created some gaps which may cause some misunderstandings ....

G
 
Last edited:
Excellent post! Thanks, APE!

Loudness has been something I've struggled to figure out, and I imagine I'm not alone. I'm quite sure I'll have a follow-up question for you on this matter, but I can't really dive into anything for another week or so. Anyway, great thread!
 
Loudness has been something I've struggled to figure out, and I imagine I'm not alone.

You and the entire worldwide broadcast industry for a couple of decades! And of course not just the broadcast industry but anyone working audio because as human beings we naturally relate to our perception of loudness but until now there was no correlation between the measurement of audio and it's loudness which is something every budding audio engineer just had to get used to. This is the reason why a calibrated monitoring environment is so vitally important, because a calibrated monitoring environment essentially means we can rely our own perception/hearing to judge loudness and just use the meters as a technical safety net.

I know it seems weird that something we can do so easily and naturally, virtually without even having to consciously think about it, just wasn't possible to measure until recently. There are still many other areas of human perception and interaction with the world which seem easy to us but which are extremely difficult even for the most powerful of computers.

I don't want to give the impression that these new loudness measurements are perfect and the whole issue is done and dusted, it's not and maybe it never will be because there is still no way of actually measuring perception. But what we have now is orders of magnitude better than anything we've had before.

I'm quite sure I'll have a follow-up question for you on this matter, but I can't really dive into anything for another week or so. Anyway, great thread!

Feel free to fire away when you're ready.

G
 
Last edited:
I don't want to give the impression that these new loudness measurements are perfect and the whole issue is done and dusted, it's not and maybe it never will be....

It would be nice if there was a "Universal" standard. It sucks if you have to do different mixes for the various networks. What works for The Discovery Channel (a subsidiary of Discovery Communications) will not be accepted by The History Channel (a subsidiary of Disney). It's getting there, albeit slowly and painfully, for the quality control people at the various audio post houses, whose clients tend to be a one or two networks.
 
It would be nice if there was a "Universal" standard. It sucks if you have to do different mixes for the various networks.

As you say, we're getting there, at least as far as loudness is concerned. An important point for others reading this is that loudness is the only aspect of deliverables I've dealt with in this thread. There are other aspects which are still quite disparate: Dipped or un-dipped stems, LFE and surround use and the positioning of dialogue, to name a few. This last one (dialogue position); some require all dialogue just in the centre channel, some allow the dialogue to move relative to the screen position of the actors, some require the dialogue diverged in a certain ratio across all 3 front channels and others have different rules depending on whether the dialogue is screen dialogue or VO/narration. Other broadcasters, some in the US but more commonly in Europe, have slightly different (but still compliant) loudness specs. For example, many of the French broadcasters have an Integrated loudness requirement of -23LUFS but peak loudness of -6dBTP. -6dBTP is still compliant with EBU R128 because -6dBTP is lower than the max peak (-1dBTP) in the EBU specs but an EBU R128 compliant mix for another broadcaster which may peak at say -2dBTP would obviously fail QC for these French broadcasters.

This might all sound like a bit of a nightmare to the uninitiated and I suppose it is, but it's still way easier than it used to be. If all deliverables do become standardised, that might not be such a good thing for us audio post professionals because some producers might decide it's easy enough to be handled by the video editor for a few extra bucks rather than having to pay knowledgeable audio post pros to produce compliant mixes. Fortunately though deliverables won't be standardised in the foreseeable future!

G
 
As a final part, I thought I'd give you a screenshot of the loudness meter I use (iZotope Insight) and explain what it's showing us:

insight_loudnessmetering.png


We've got two panels, the top one is Levels and the bottom is Loudness History.

Loudness History is just a plot of the loudness of our film/program over time. The purplish straight line is our target integrated loudness, in this case 24LUFS. The white plot is the momentary loudness of our material over time and the red/green line is showing us how the integrated loudness is developing over time. Obviously it doesn't matter if there are areas of red, as long as there are enough areas of green over the course of the program to average out to -24LUFS. If, when we reach the end of the film, the integrated loudness is higher than -24LUFS the red parts of the history line tells us where we need to be looking to fix the problem or, the green parts show us the problem areas if our mix is below target. BTW, this history plot can be printed out as a log (text file), to accompany our deliverables and prove compliance.

Levels: Starting with the left section in our Levels panel: We see what looks like a standard meter but of course the vertical figures (y-axis) are LUFS values not dBFS! The green numbers running horizontally across the top (first one is -6.6) are our indefinite peak hold readings (the highest peaks which have occurred at any time since we pressed "play"). This reading is in True Peak (dBTP) of course, not dBFS. The white figures directly underneath the green ones are the current integrated loudness values for each channel. The bars in the meters themselves effectively show three points: The highest one (just a line) is a 3 second peak hold. The next one down, in darker green, shows the momentary loudness (k-weighted RMS value over the last 400ms) of each channel. The lowest section of each bar, in brighter green, is showing the integrated loudness (k-weighted RMS value since we pressed play) for each channel.
The centre section is showing us: Starting at the top, the overall integrated loudness (so far) of all the channels together. Next down is the overall loudness over the last 3 seconds (Short-Term loudness) of all the channels summed together and then underneath this is the max Momentary loudness of any individual channel over the last 400ms (which in this example we can see occurring in the centre channel). And next to the Momentary loudness is the Loudness Range Average (LRA), which is the average dynamic range (so far) in LUFS. The box underneath is just where we can set our peak and loudness targets. The three bars on the right are just giving us a graphical meter bar type representation of the same information displayed in the centre section: I = Integrated loudness, S = Short-Term loudness and M = Momentary Loudness. The yellow lines either side of the Integrated loudness bar are indicating the LRA.

I don't expect many here to be spending $500 or so on a metering plugin but there are some free ones hitting the streets. There's the obvious caveats though, free software might not provide accurate readings, probably won't give you the same level of detail or amount of information and of course might contain bugs or viruses. Here's two which are from respected companies:

The Orban Meter is standalone software (rather than a plugin) for mac and win. Here is Steinberg's SLM 128 which is a VST3 plugin for mac and win. For some reason, this plugin made by Steinberg themselves is listed in their "unsupported" section, maybe it's inaccurate or there's some other issue with it but Steinberg don't seem to explain anywhere.

A last word of warning: The ITU standard is currently at ITU-R BS 1770-3. The revision from 1770-2 to 1770-3 doesn't affect the readings but the revision from 1770-1 to 1770-2 includes the gating mentioned in the Part 4 post, so a 1770-1 meter will give a different integrated loudness reading from a 1770-2 meter! So, if you do come across a free loudness meter you like the looks of, make sure it's compliant with at least ITU-R BS. 1770-2 and not only 1770-1.

G
 
Last edited:
I'm starting this thread in response to another thread where an IT member was using audio (dB) levels as a reference to loudness. I pointed out that there is no correlation between dB levels and loudness, which eventually led to several members expressing interest in knowing more about loudness and the way it is measured.

I had to study this a bit just recently when processing sound for possible broadcast. I could've used this info then! The broadcast requirements are all in loudness (and with different units!), and it was a completely new concept to me.

I got a plugin to help with this, but didn't really understand what I was looking at. Thanks for posting the screenshot.

One minor nitpick- you say there's no correllation between db and loudness, but then you post a graph that clearly shows correlation between the two. There absolutely is a correlation. It's just not a linear one, and is based on human sensitivity to the input frequency.
 
One minor nitpick- you say there's no correllation between db and loudness, but then you post a graph that clearly shows correlation between the two. There absolutely is a correlation. It's just not a linear one, and is based on human sensitivity to the input frequency.

I think you must have misunderstood? There can be no correlation between dB and loudness if measuring loudness also depends on another unrelated measurement, the frequency in this case. In other words, there is no way of ascertaining loudness from a dB value alone and therefore there is no correlation. To measure loudness we have to change the dB scale by k-weighting (and averaging) it but of course, changing the dB scale means that it is no longer the dB scale, it's some other new scale (LUFS/LKFS).

Also, the broadcast reqs usually had a max momentary lufs... How do you look for and how do you correct that? And... What is it?

I can only remember seeing a Momentary Max as part of some broadcasters' TV commercials specs, most (though not all) broadcasters in Europe who have already adopted EBU R128 only specify an Integrated value (-23LUFS) and a True Peak max (usually but not always -1dBTP) as far as loudness is concerned. Unlike the USA where loudness normalisation is a legal requirement, in Europe it's only currently a "recommended practise". European broadcasters are changing over to EBU R128 but it's a little piecemeal at the moment, with some broadcasters only using part of the R128 specs while keeping parts of their old specs (a lower max peak in dBFS for example) and so far it's only the richer EU countries which have fully or partially implemented it. So, at this instant in time there are still no standardised loudness specs across all broadcasters in Europe yet, although it is heading that way.

I explained Momentary max and the other loudness averaging durations in post #12 and also mentioned Momentary values in the "Levels" section in my last post (#17).

G
 
Last edited:
Back
Top